Summary: Successful traders use various methods to gain an edge, focusing on technical analysis rather than fundamentals. They should be prepared to trade in both directions after trends and take profits around previous highs or lows. Keeping a daily trading plan and logging trades helps improve discipline and decision-making.
Avoid using oscillators after a volatility extreme such as a buy or sell climax. Avoid using oscillators when the trading range is too narrow and volatility is low. (View Highlight)
When the ADX has risen above 30, this indicates that the market has picked up enough momentum that any reaction should be followed by a retest. We like to call this the “Holy Grail†trade (as originally described in the Street Smarts book).
The initial condition for a Holy Grail setup is that the ADX rises above 30. Price must then retrace back to the 20-period EMA. Sometimes price can run a bit through the 20-period EMA, but it is expected to find support or resistance around this level. By the time that the price has retraced towards the EMA, the ADX will have turned down. This is OK. The objective for the trade is a retest of the previous high or low area. (View Highlight)
When looking at intraday charts for grail setups, you will increase your odds of a successful trade if you use multiple time frames. The best trades occur in situations where the ADX level is high on several time frames. The market should always retrace first to the shortest time frame’s moving average. For example, in a strong up trend the S&P should retrace to the 30-minute EMA first, find support and rally back up. The next retracement will be a bit deeper and pullback to the hourly EMA. After the hourly grail gets its objective, if there is still a rising ADX on the 120- (View Highlight)
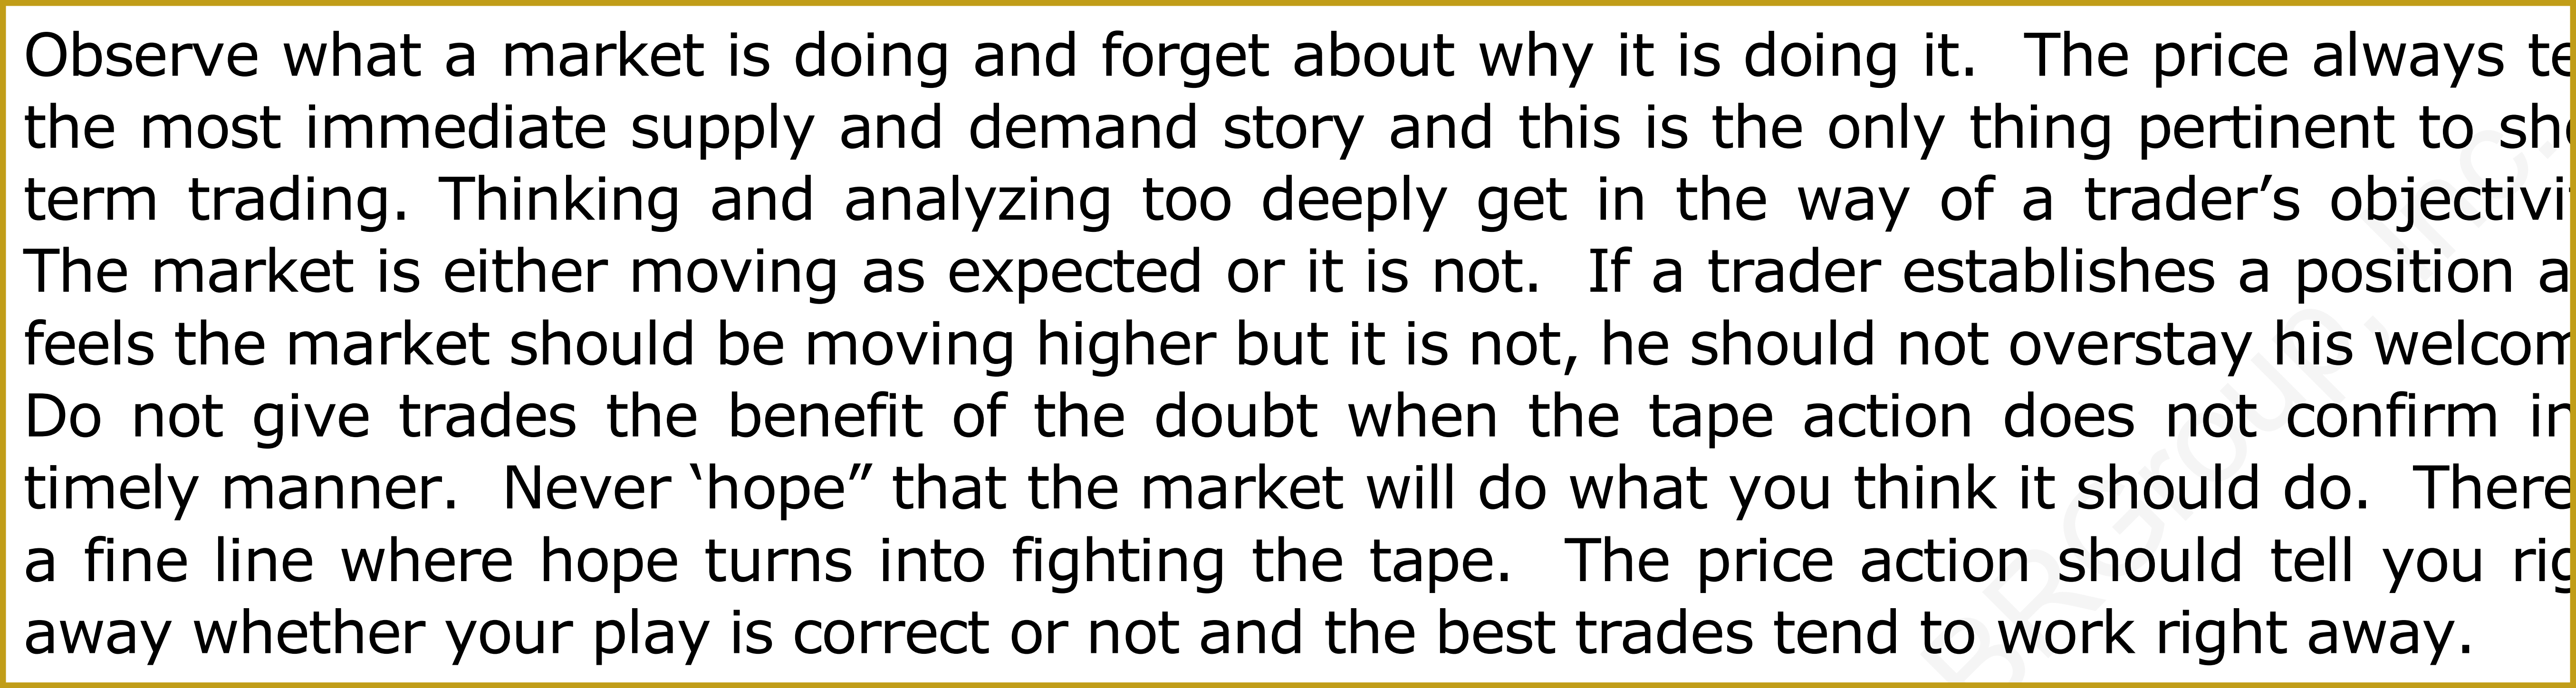
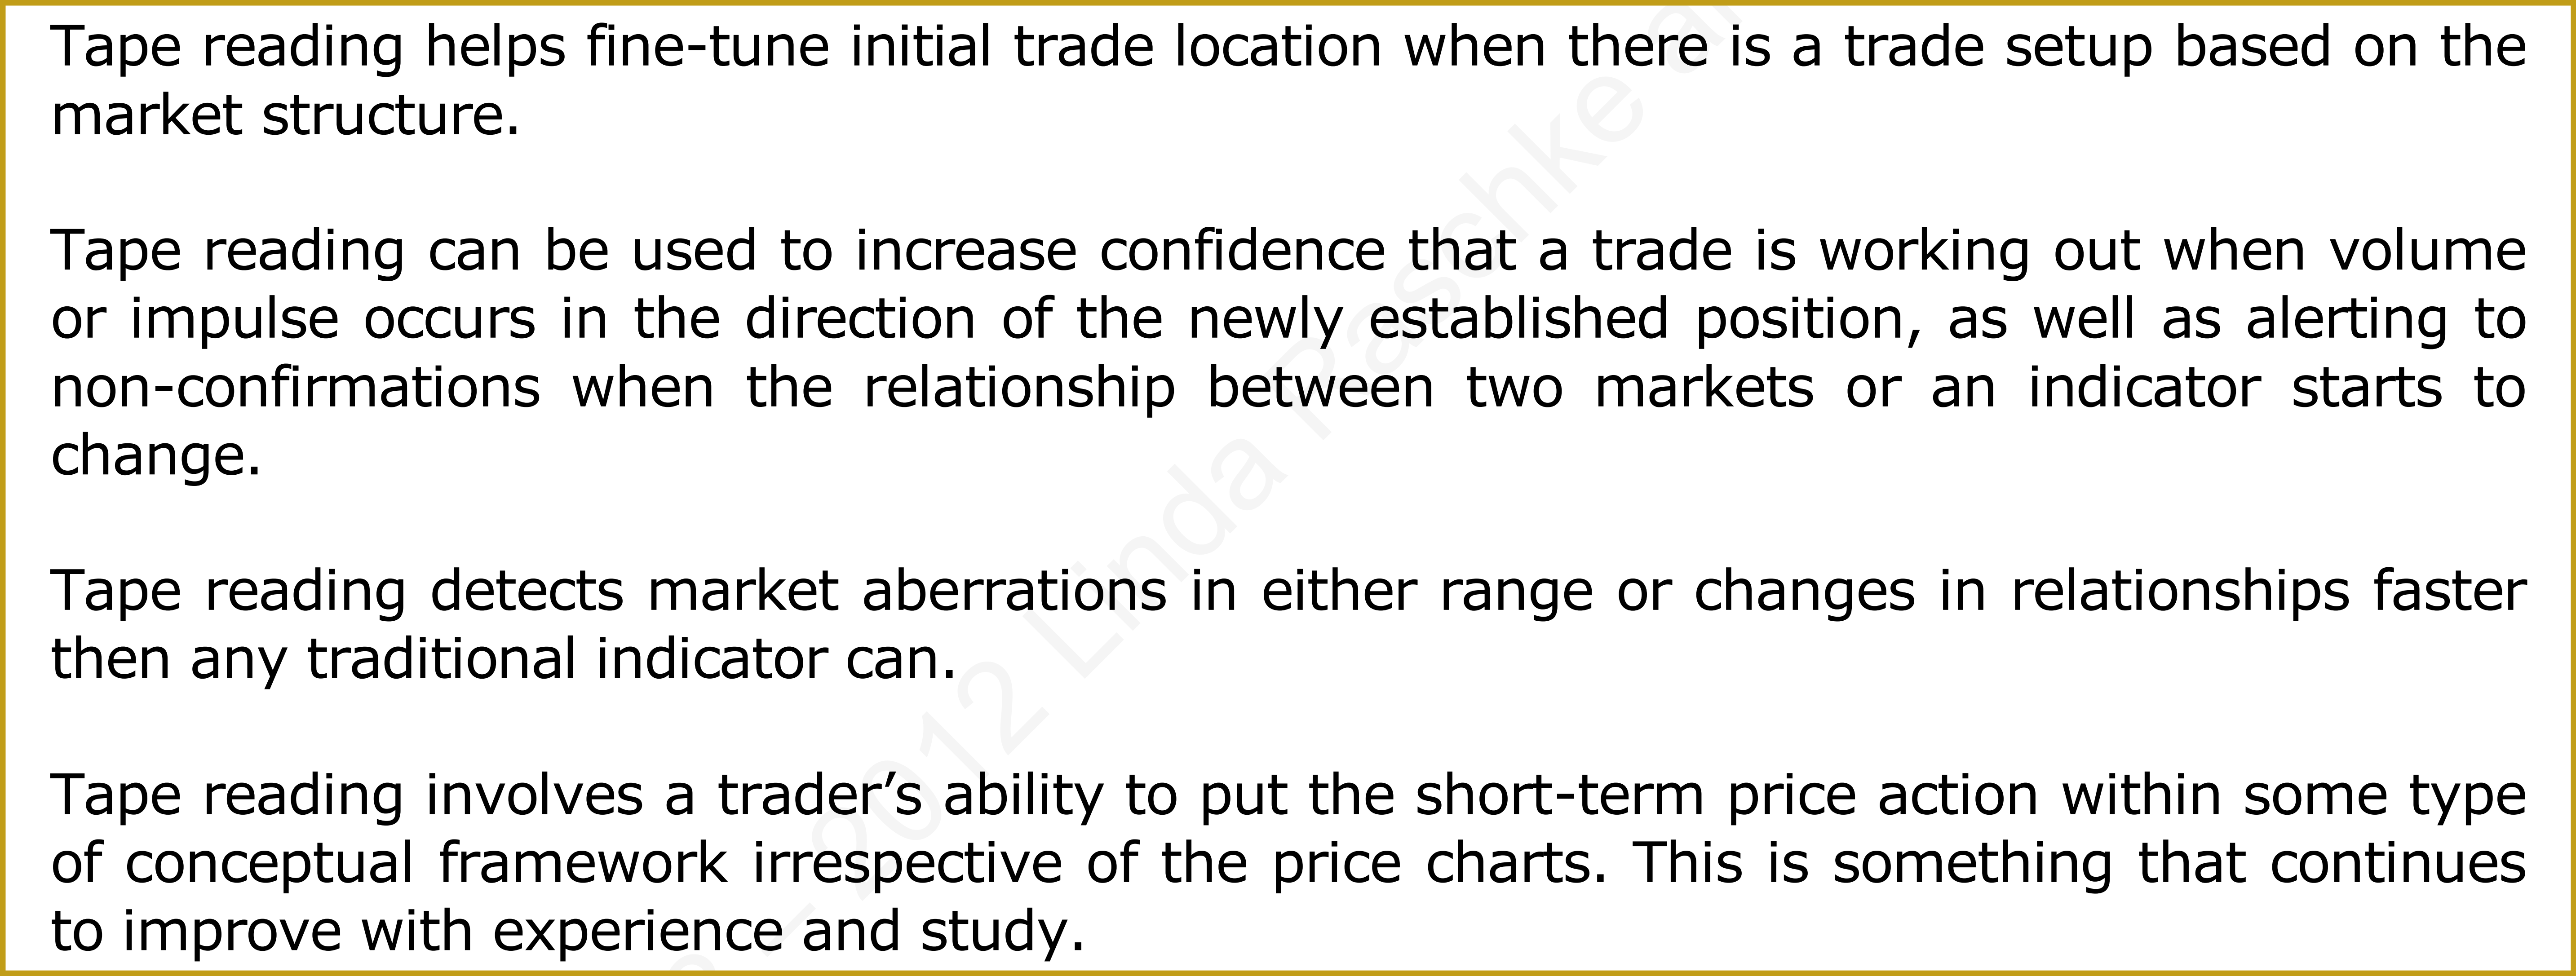
The basic premise of tape reading involves nothing more than watching the current price action to determine whether buyers or sellers are in control. Which is greater: supply or demand? This is of course, reflected by patterns of higher highs and higher lows, or vice versa, as well action indicating impulse. So, in addition to noting if the price is moving up or down, a trader is monitoring the overall activity level, which can show up in volume as (View Highlight)
 (View Highlight)
 (View Highlight)
 (View Highlight)
 (View Highlight)
 (View Highlight)
 (View Highlight)
 (View Highlight)
 (View Highlight)
 (View Highlight)